

Good reporting capabilities are essential to Agile teams using Jira Software - and for good reason! Data visualization tools are essential for promoting good communication and collaboration. One of the most sought-after reports is included in Jira Software out of the box: the burndown chart. Read on to learn how Jira makes it easy to generate and share the burndown chart with your team and stakeholders.
The Inputs
- A Scrum Board: In Jira, the burndown chart is accessible through Scrum boards only.
- To create a scrum-type board, follow these instructions from Atlassian. Column mapping is a key configuration point, as it's the basis for the burndown chart.
- An Estimation Statistic: Determine how your team will measure work, and set an estimation value on each of the issues in your sprint.
- Jira accommodates for Story Points, original time estimate, issue count, or any custom field, provided that the custom field is a numeric custom field type.
- We know that this can be a sticking point for your team and asked our Principle Amanda Babb to shared her thoughts about Scrum Team time tracking to help you along the way.
- An Active Sprint: Once your sprint starts, begin to review your team's progress.
The Interpretation
Once the sprint starts, you can review the burndown chart along the way to understand the amount of remaining work in a particular sprint and gather feedback on the sprint itself. Below are a few scenarios that the burndown chart captures:
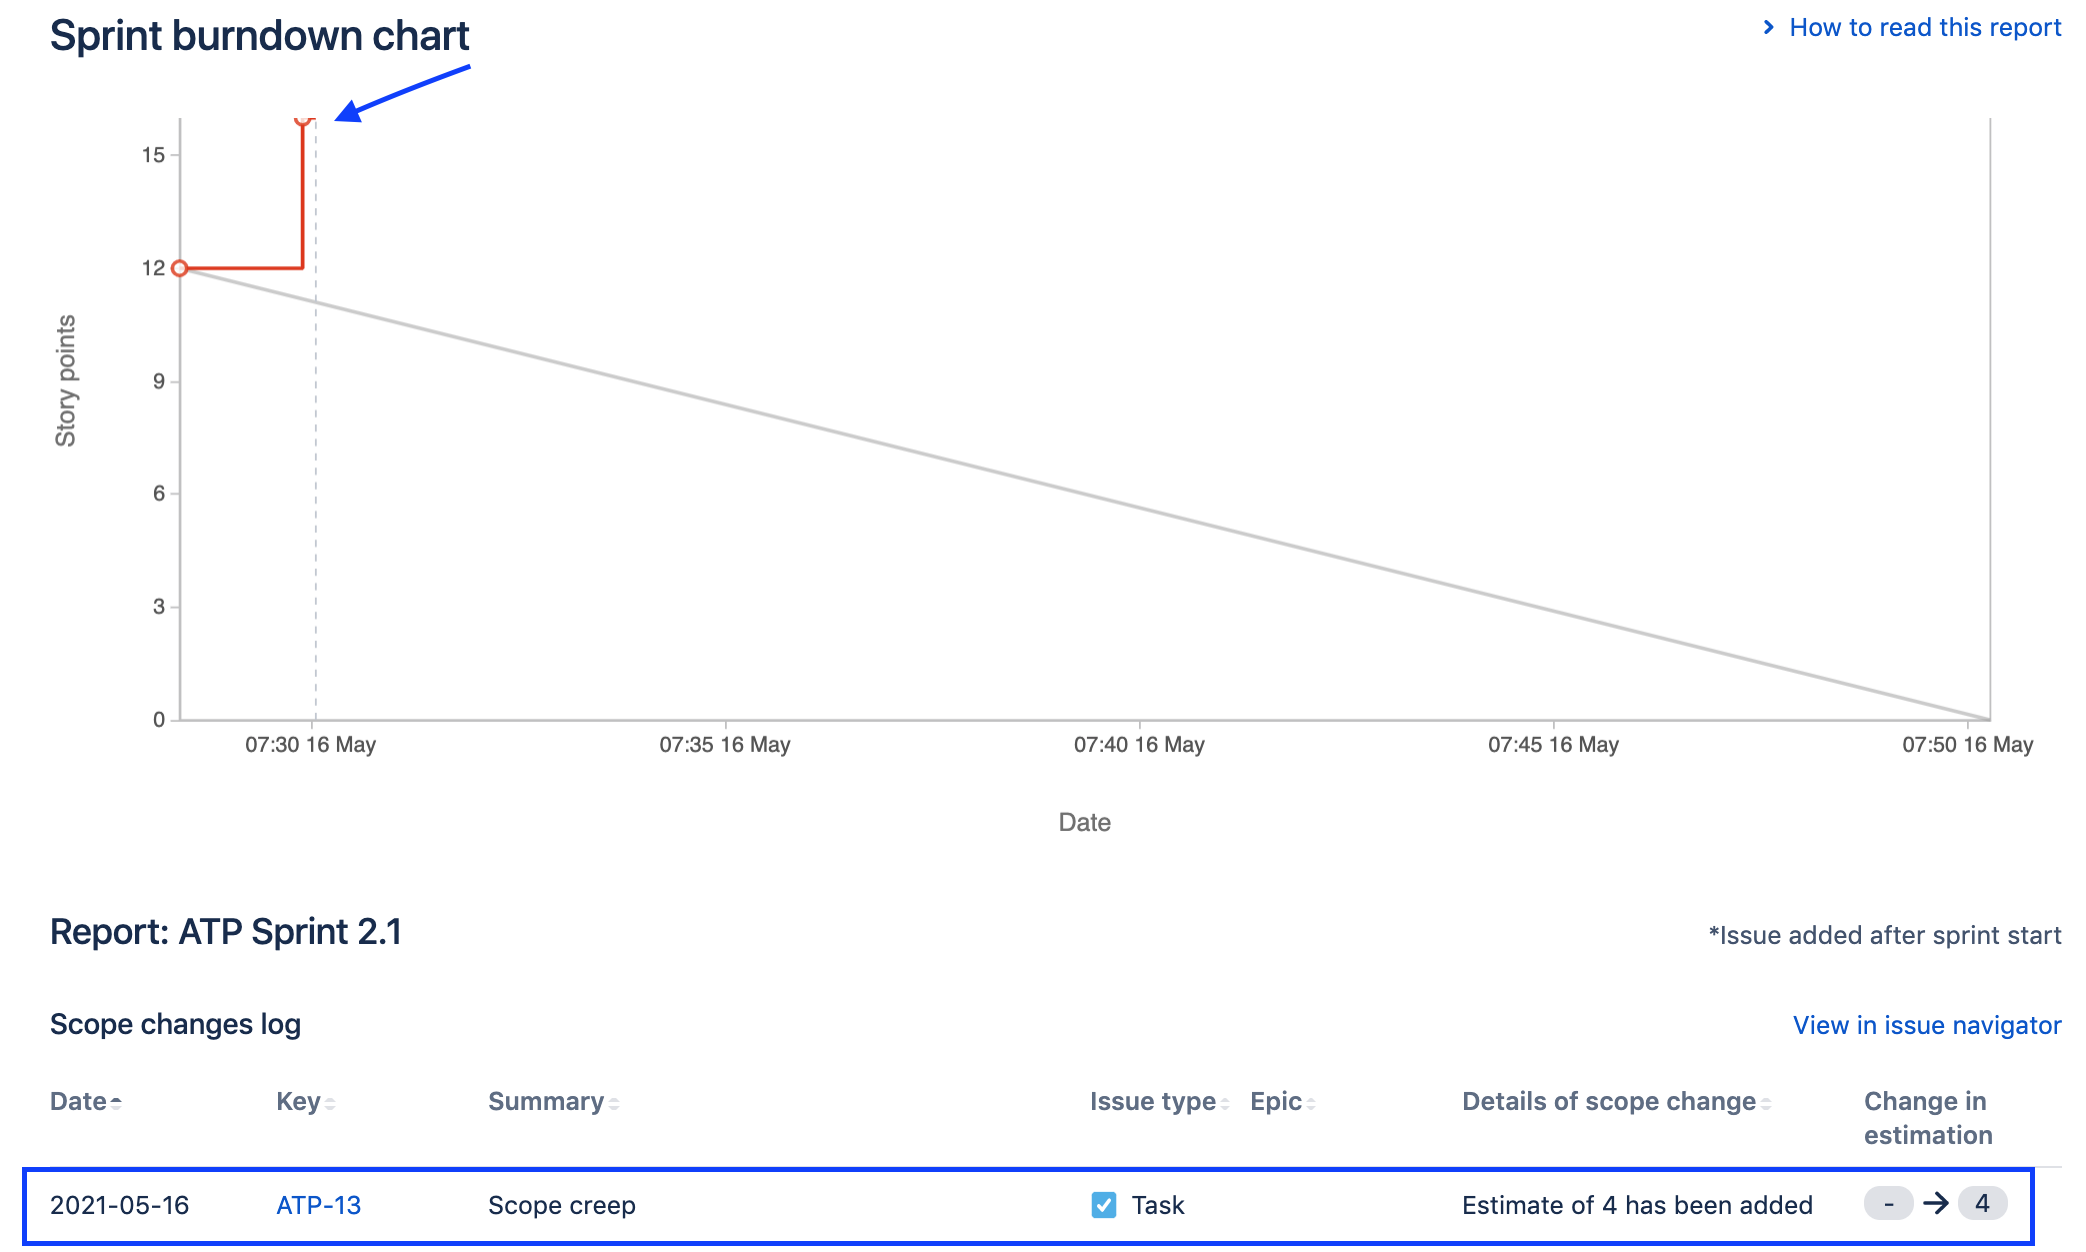
Scope Creep:
Scope creep is often unavoidable, so it's necessary to understand when they occurred especially if your team is no longer on target to meet its sprint goal. Here, the burndown chart reflects an increase in scope.
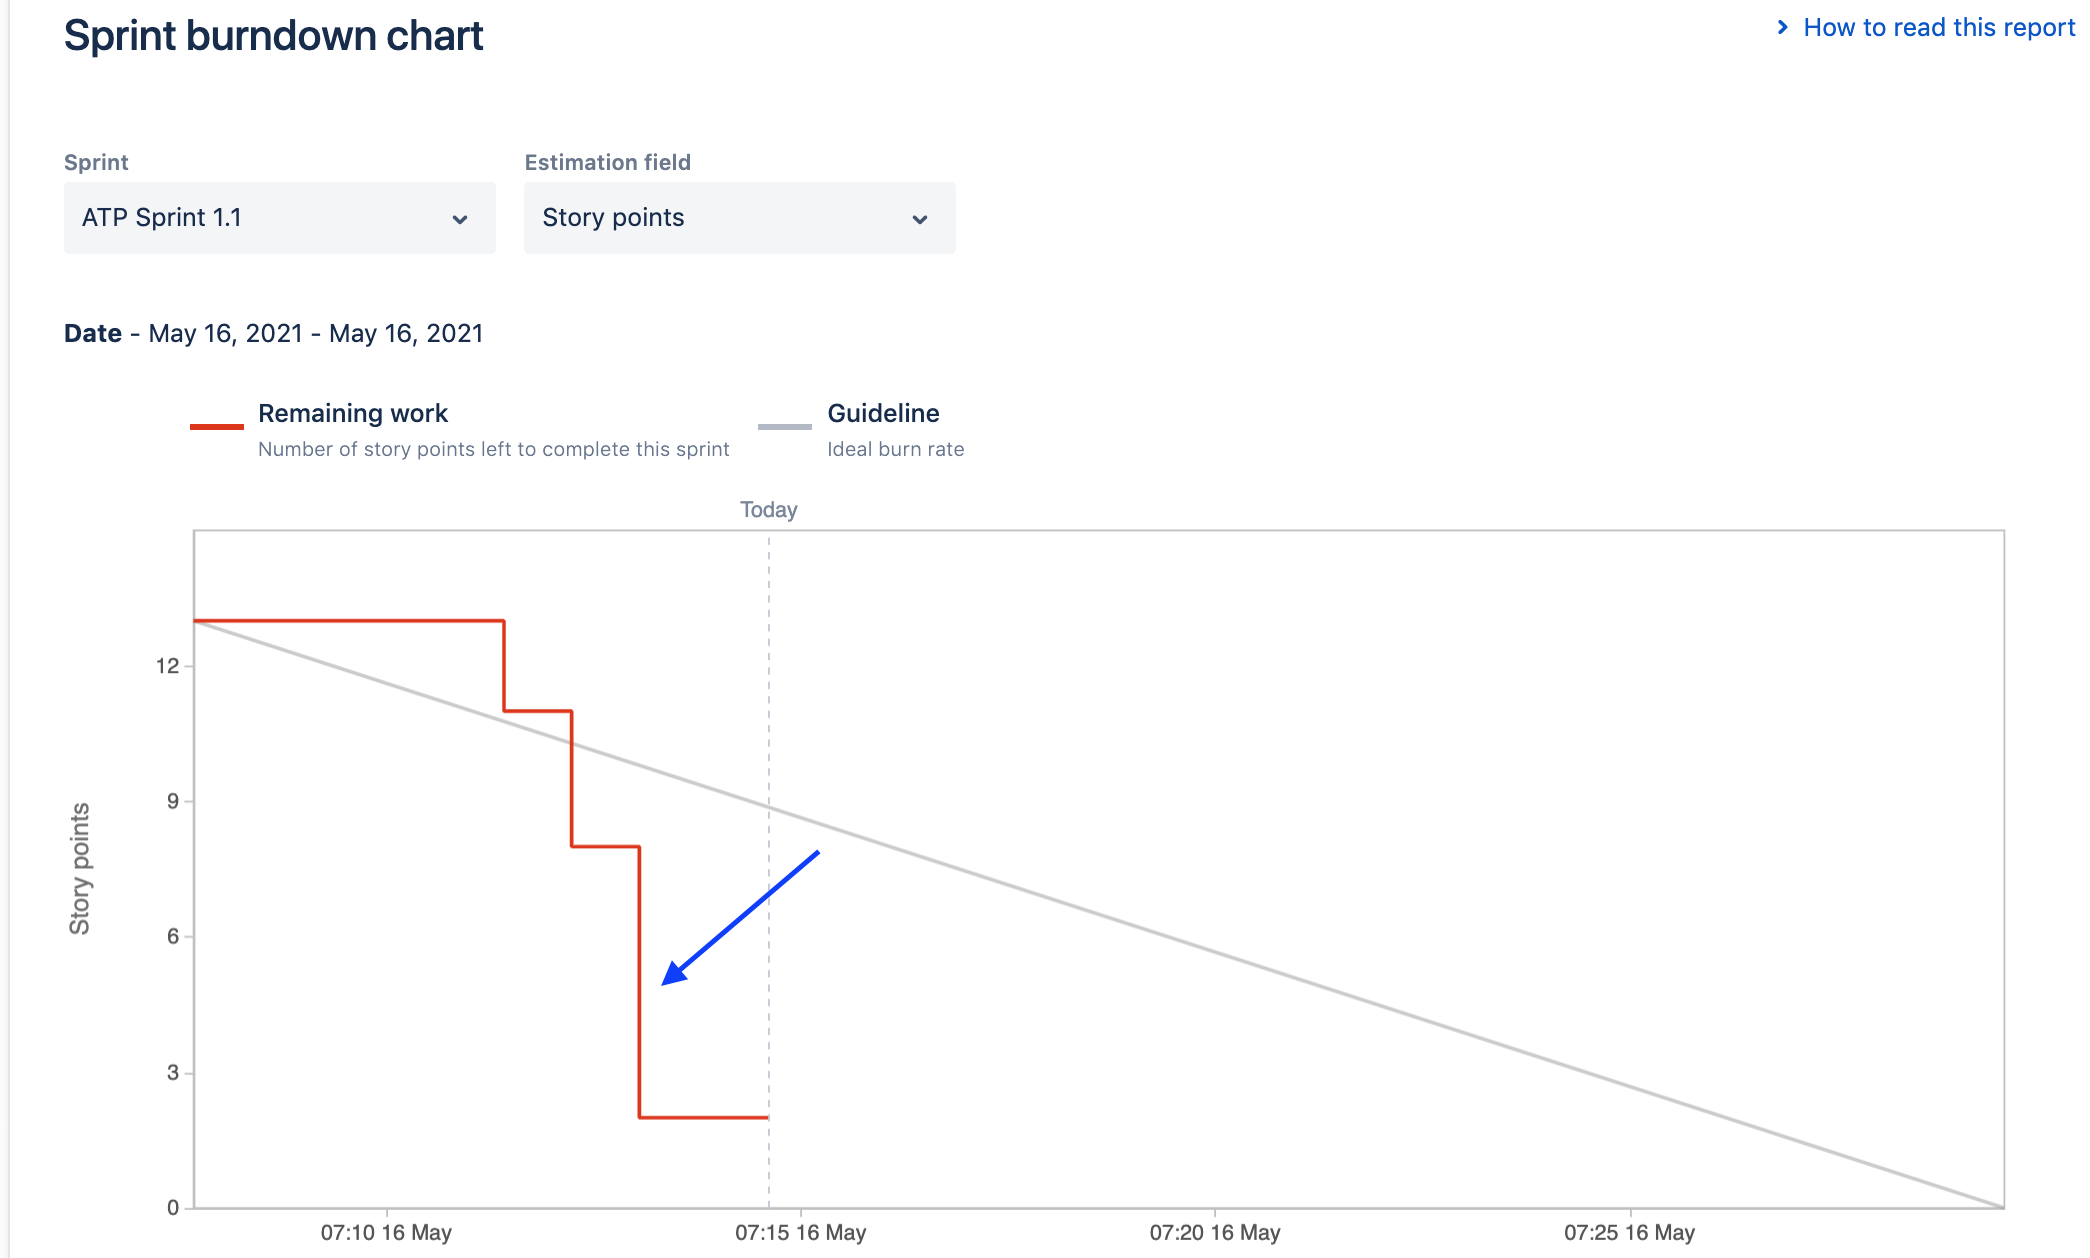
Opportunity for Alignment:
It's important for the team to collaborate and land on an estimate for each work item in the sprint - not so much for the actual estimate itself but more for the shared understanding based on the requirements. This is often seen in both over and under estimates on the burndown chart. Below, the burndown chart reflects where some work was overestimated; the team is on track to complete the work well before the end of the sprint.
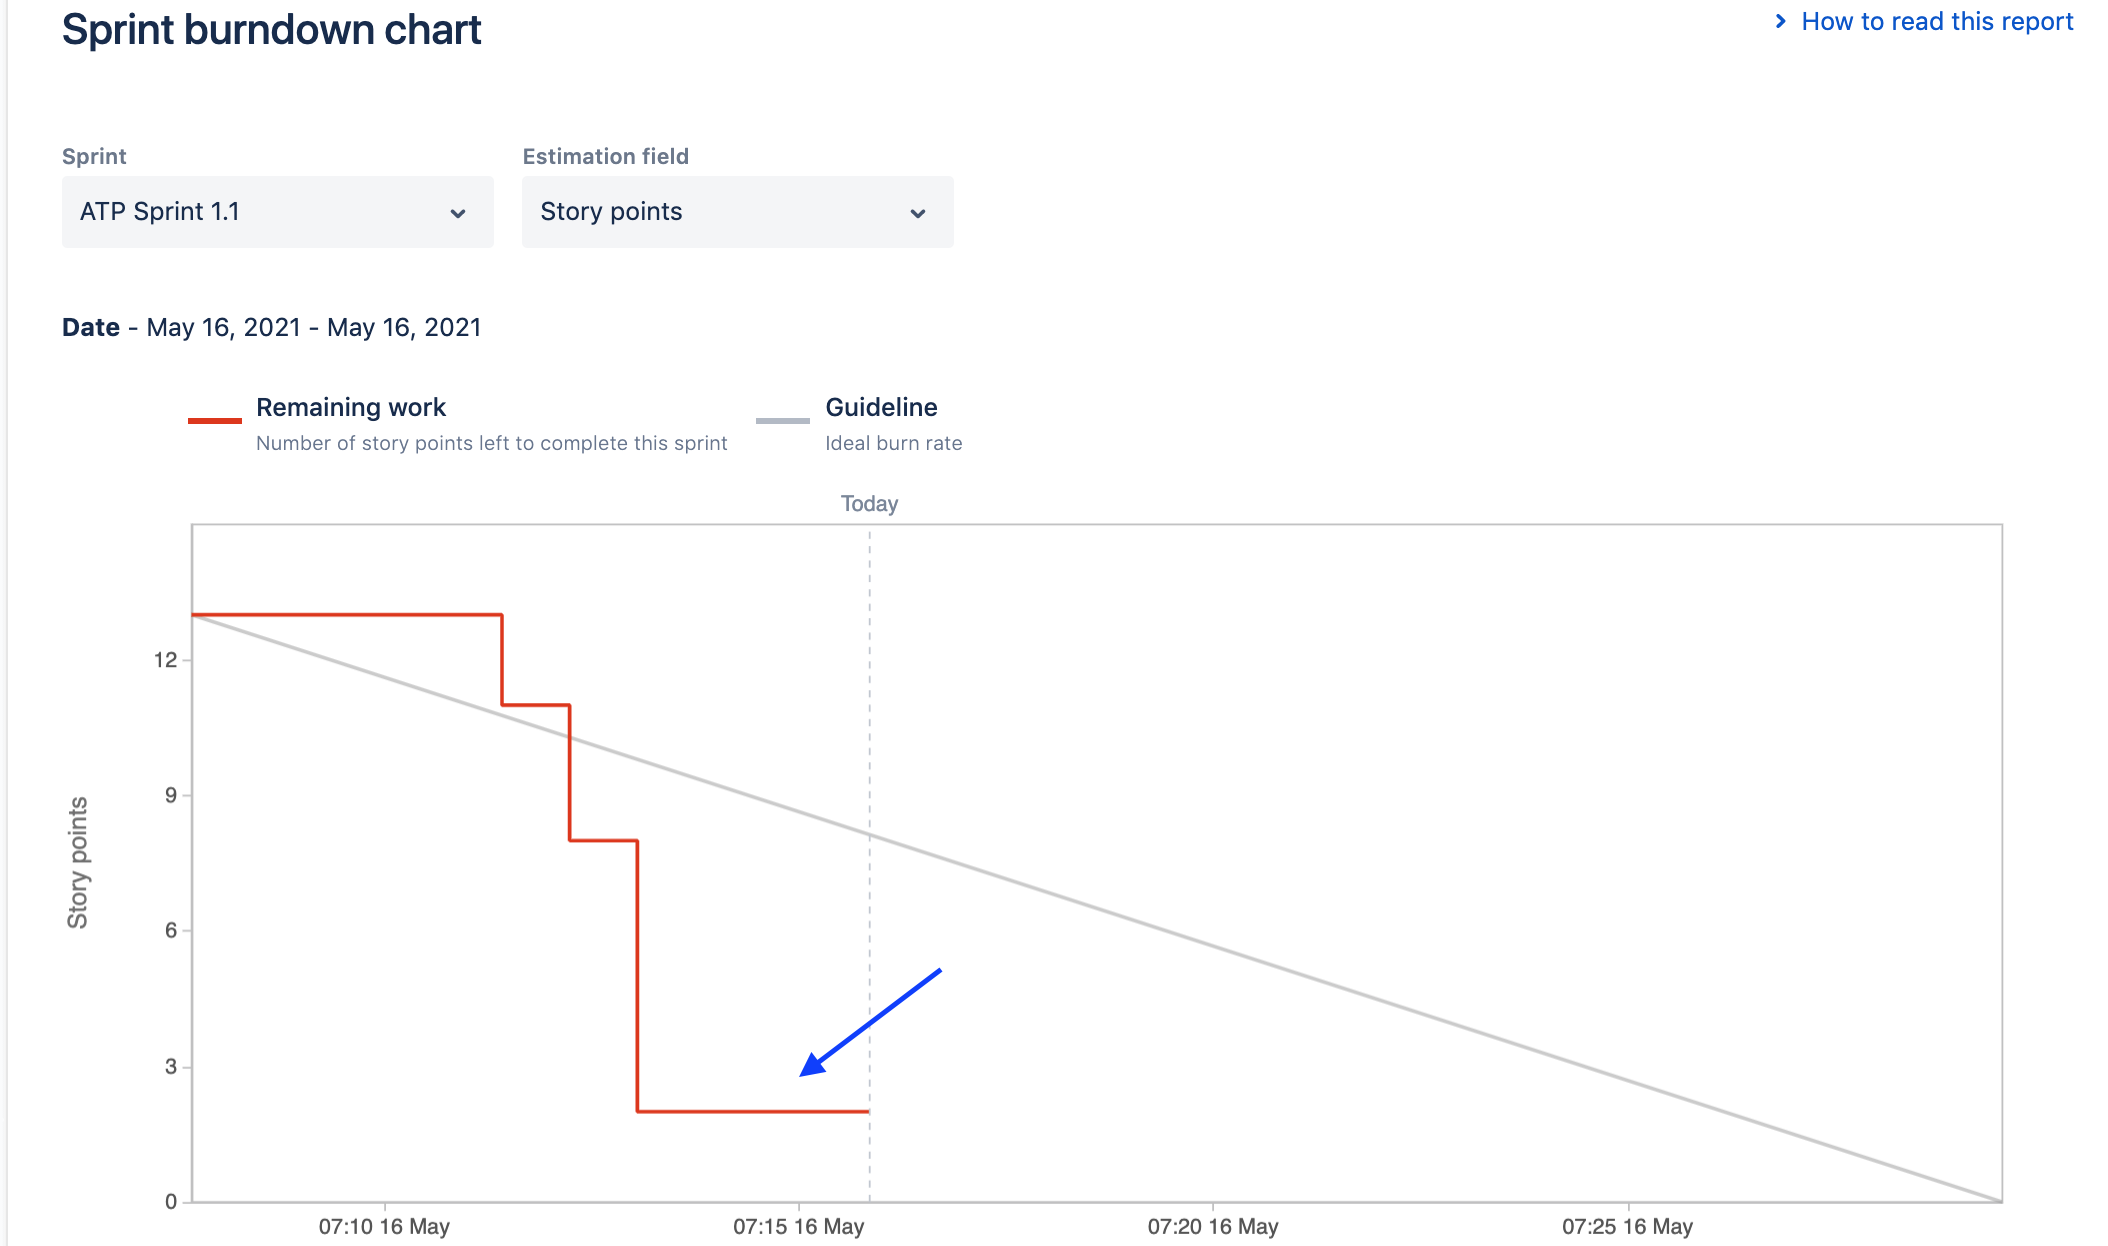
Plateaus:
Plateaus on the burndown chart are typical when you have a team who is either new to Agile as a whole or new to working together. It's an indication that the team got off to a good start early on, but didn't carry the effort through the remaining work items.
Ready to learn how Jira Software can help your Agile teams collaborate and communicate while working in Agile sprints? Drop us a line!