

Or at least the version of it most organizations are still running. Here's what to do instead.
Every Monday morning, somewhere in your organization, a project manager opens a spreadsheet. They click into a ticketing tool. They open another tab to a service management platform. They read a few comments, walk over to a teammate's desk for information, type a paragraph, screenshot a chart, paste it into a slide, attach the slide to an email, and send it to leadership.
Leadership gets a big powerpoint, they flip to the one status page. Maybe they do this on Thursday. Almost a whole week has passed. They look for the big Red, Yellow, Green and as long as everything is still green, they close the laptop and move on.
The cycle resets the next week.
This is status reporting in 2026. It is a workflow that has barely changed in fifty years, performed in software that has changed beyond recognition. The shape of the artifact — the weekly executive update — is older than email. It is older than the personal computer. And the assumptions that made it necessary are no longer true.
We want to make a case in this article that those assumptions are worth revisiting. Not because executives don't need information about their portfolios — they do — but because the way that information has been packaged for the last several decades was built for a different world. AI now closes the gap that status reporting was invented to bridge. The question is not how to do the same report more efficiently. The question is what the report was actually trying to do, and how to do that better.
How we got here
The modern weekly status report, with its risks, issues, decisions, and milestones, was codified in PMBOK during a pre-computer era. To answer those questions then, a project manager had to walk the floor. They had to talk to people. They had to keep a handwritten or typed list and aggregate everything into a written report that would be circulated up the chain.
The list and the report were necessary artifacts because there was no other way to surface what was happening across a project. Information lived in people's heads, in conversations, in physical artifacts on desks. The status report was the only way to get a portfolio-wide view of work.
As computers arrived, those lists moved into spreadsheets and shared drives. But the underlying job — a human aggregating information from disconnected places — did not change. The shape of the report stayed the same.
Agile changed the conversation but did not change the report. Standups and cadence-based ceremonies began to resolve many decisions and issues in real time, as a team, with the people who could act on them. The remaining function of status reporting became escalation: the gap between people doing the work and the leaders who need to know about it. Because that gap persisted, the weekly status report persisted with it.
We are now in a different age. Every artifact in the work environment — the initiative, its children, its dependencies, its comments, its dates, its history — is queryable by AI. The aggregation job that used to require a person can be done by an agent in seconds.
The question is no longer how to capture the same information more efficiently. The question is what leadership actually needs to know, and what they need to take action on. If leaders only need to read the same report each week, that is a sign they are not in fact making decisions from it. A leader's role is to understand where decisions need to be made — and those are the things our reporting should surface.
PMBOK has produced a lot of papers on whether something is technically a risk or an issue. We do not need to settle that debate. What we need is a different question: what decision is in front of us right now, what is at risk of slipping, and what does leadership need to act on? That framing — outcomes over artifacts — is what AI now lets us deliver.
The familiar pattern
When organizations decide it is time to modernize this, the instinct is to tidy up. To move the existing fields from one system to another so the same report can be assembled with less friction.
We worked with a portfolio team recently who came to us with exactly this kind of request. Their delivery managers were spending two to three hours per initiative every week pulling status information from their Jira tool, re-entering structured fields into a service management platform, screenshotting the resulting view, pasting it into a PowerPoint slide, and emailing it to executive leadership.
They wanted to remove the duplicate entry and the screenshot. The instinct was to push the fields directly from Jira to Power BI so the executives could see live data in the same layout they were used to.
It was a reasonable request. It would have eliminated several hours of work per cycle. It would have improved data freshness. And it would have preserved every assumption about the report that had been baked in over decades — five fixed sections to fill in, a fixed visual layout, the executives still receiving a deck in their inbox.
We built the proposal. And then we put it aside to ask a different question: what if the goal is not to preserve the report?
Tier 1: A starting point: write the story, let the system handle the rest
The simplest version of a different approach does not require AI at all. It just requires letting go of the fixed template that was designed to mirror a PowerPoint slide, and replacing it with a template designed to capture what only the human knows.
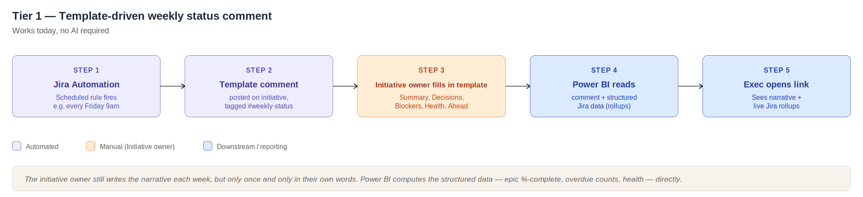
Here is what we propose. On every active initiative in Jira, a scheduled automation posts a templated comment each week, tagged so reporting systems know where to find it. The template has five sections, but they are not the old ServiceNow-PMBOK buckets. They are framed around what leadership needs to act on:
- Summary. One to three sentences on where the initiative stands this week.
- Decisions Needed. What leadership input would unblock progress.
- Blockers / Off-track. What is at risk of slipping or has already slipped.
- Health. Green / Yellow / Red, with a sentence of context.
- Looking ahead. The one or two things to watch next week.
Notice what is not in the template: no "Risks vs Issues" distinction (we are past that debate), no "Achievements" section (the system already knows what got done), no fields that duplicate what the data already shows. The template captures what only the human knows — the judgment, the political context, the thing not yet visible in the data — and leaves everything else to the systems.
The delivery manager fills in the comment once a week. Power BI reads it. Adjacent tiles in the same report compute the structured rollups directly from the Jira data: epic %-complete, count of overdue children, current health field, count of open risks or issues. The human narrative sits next to machine-computed truth. The executive opens a link and reads both, live.
Something like this:
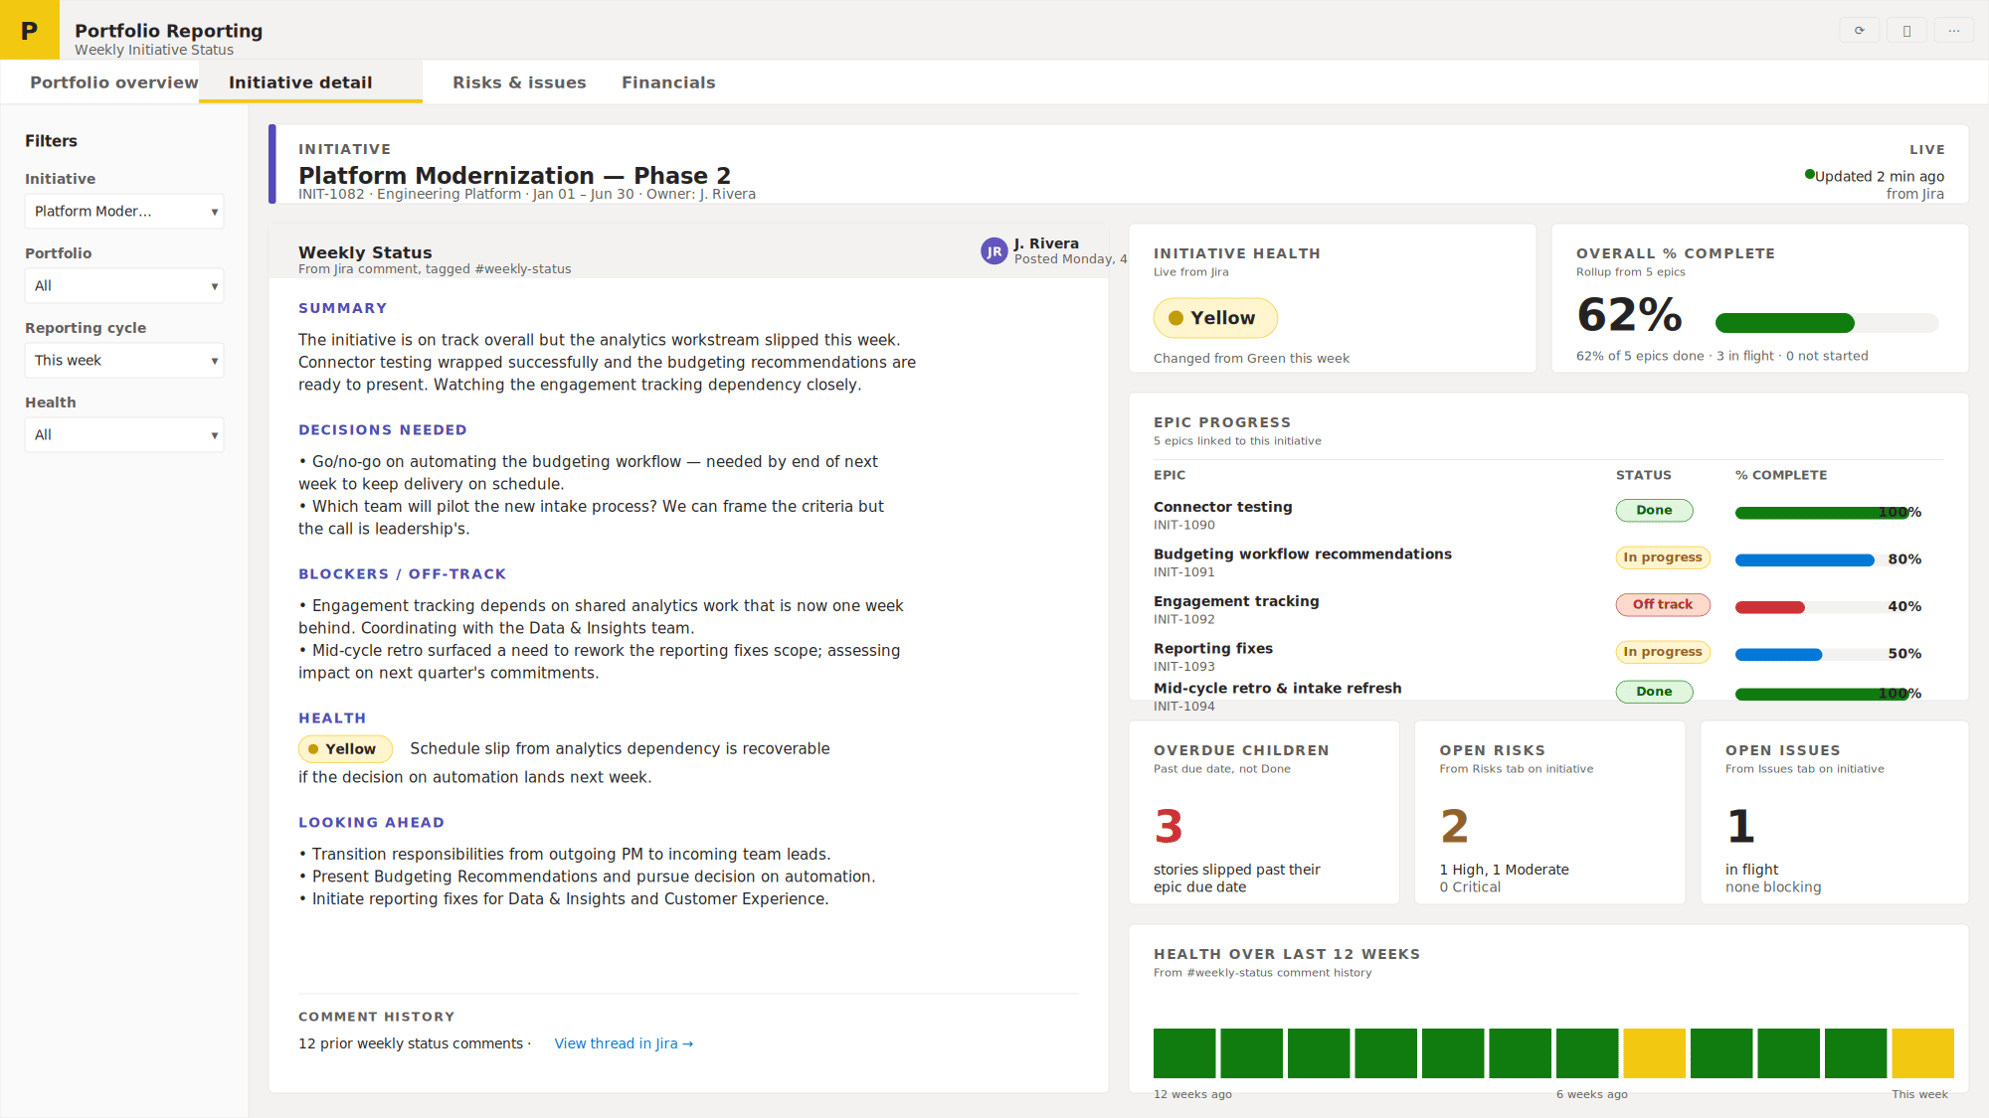
Here is what the process looks like end to end:
Why the comment field?
A custom field stores this week's status; a comment thread stores every week's status, with authorship and timestamps preserved automatically. Achieving the same with a custom field would require building a separate mechanism to preserve every change to that field over time.
Bottom Line
This works today. It requires no AI, no add-ons, no new tooling. The scheduling capability is native to most modern Jira platforms. The comment thread preserves history automatically, with timestamps and authorship. The narrative is in the delivery manager's own words. The executive never sees a screenshot.
Pros and cons
|
✓ Pros |
✗ Cons |
|
Uses native comment history — preserved automatically with timestamps and authorship |
Delivery manager still writes the narrative manually each week |
|
Works today: no new tooling, no add-ons required |
Consistency depends on the team filling out the template completely |
|
No AI dependency |
Template parsing in reporting tools requires consistent section labels |
|
Narrative written once, in the writer's own words — no five-box re-entry |
Reporting tiles still need to be designed |
|
Reports are never screenshotted; executives read live data |
|
|
Scheduled automation is built into most platforms natively |
That is the floor. Most organizations could implement it in a sprint or two. The interesting question is where it goes from there.
Three further evolutions
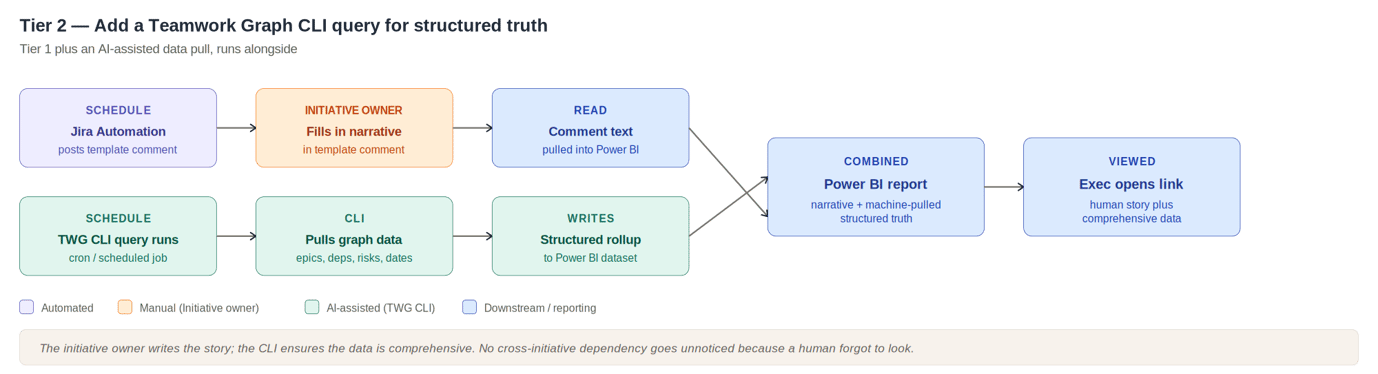
Tier 2: Add structured truth from the teamwork graph
The next evolution adds a scheduled query against an enterprise context graph - called the ‘teamworkgraph’ in Atlassian - a layer that knows about the relationships between work items, people, dependencies, and timelines across all your work tools. Claude Code, Gemini, Codex can hook easily into the teamworkgraph using the Command Line Interface (CLI). Schedule a query using the CLI of a group of initiative ids from Jira, tell the graph to look for the things a human might miss: dependencies slipping across initiative boundaries, risk levels rising since last cycle, decisions captured in comments that haven't been flagged, dates that have quietly moved. Feed the results to Power BI. That structured data feeds into the same reporting view alongside the human-written narrative. The human writes the story; the agent ensures the data is comprehensive.
|
✓ Pros |
✗ Cons |
|
Everything the first tier offers, plus an automated structured data pull |
Graph and CLI tooling for this is still maturing |
|
AI ensures no off-track dependency goes unnoticed because a human forgot to check |
Requires a host to run the agent (a scheduled job, CI pipeline, or workstation) |
|
Permission-aware querying — agents only see what the running user can see |
Requires someone to set up and maintain the agent skills and queries |
|
Augments rather than replaces the previous tier — graceful degradation if the agent fails |
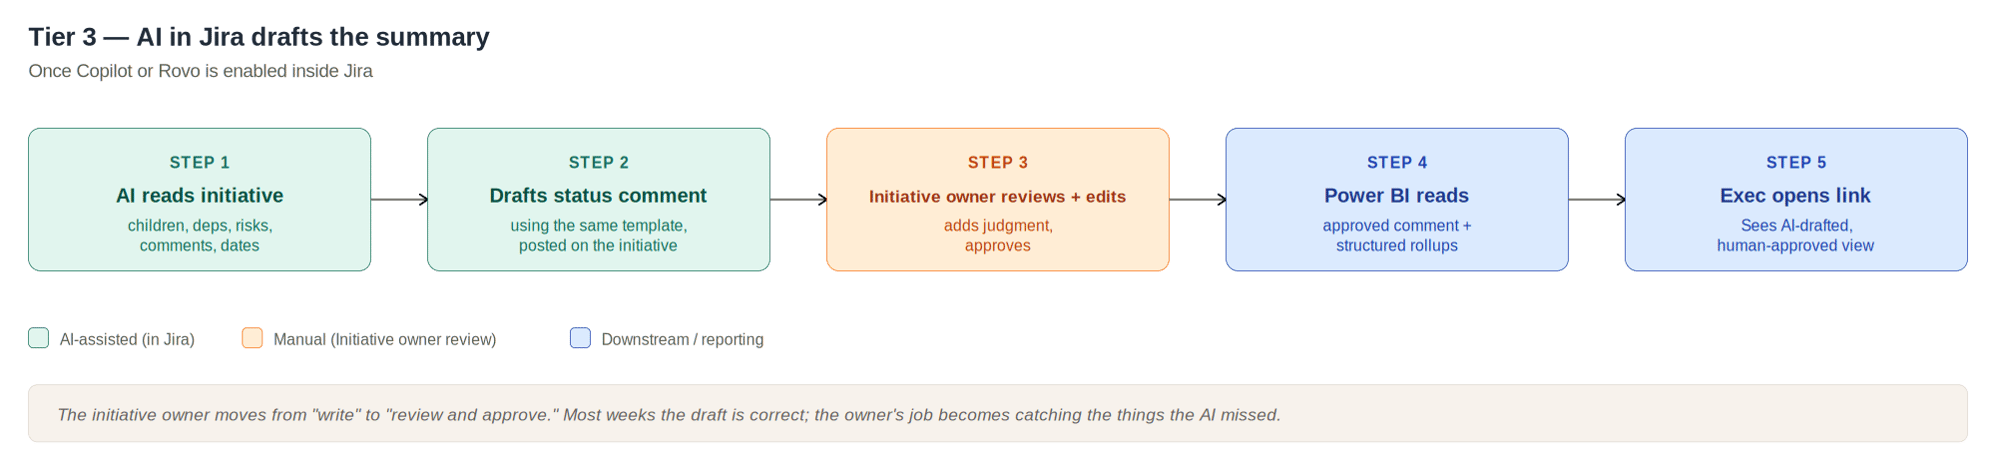
Tier 3 - Let AI draft the summary
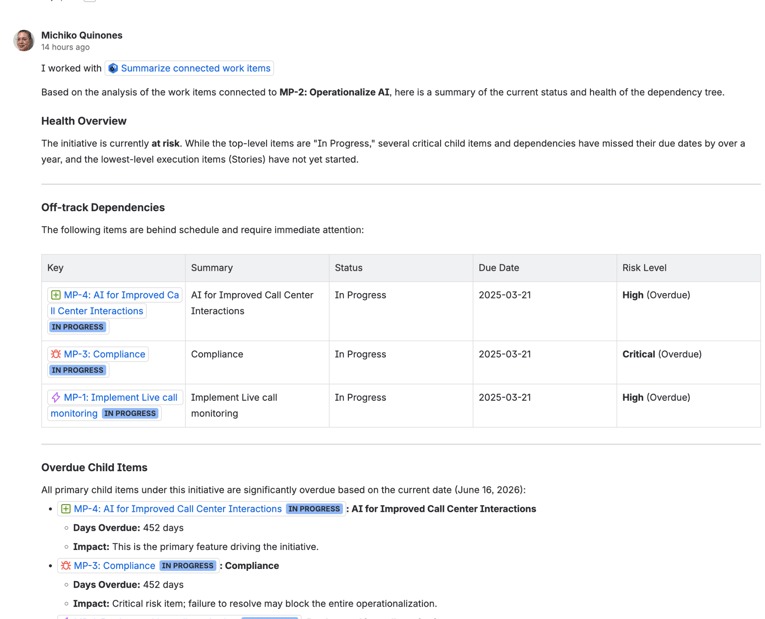
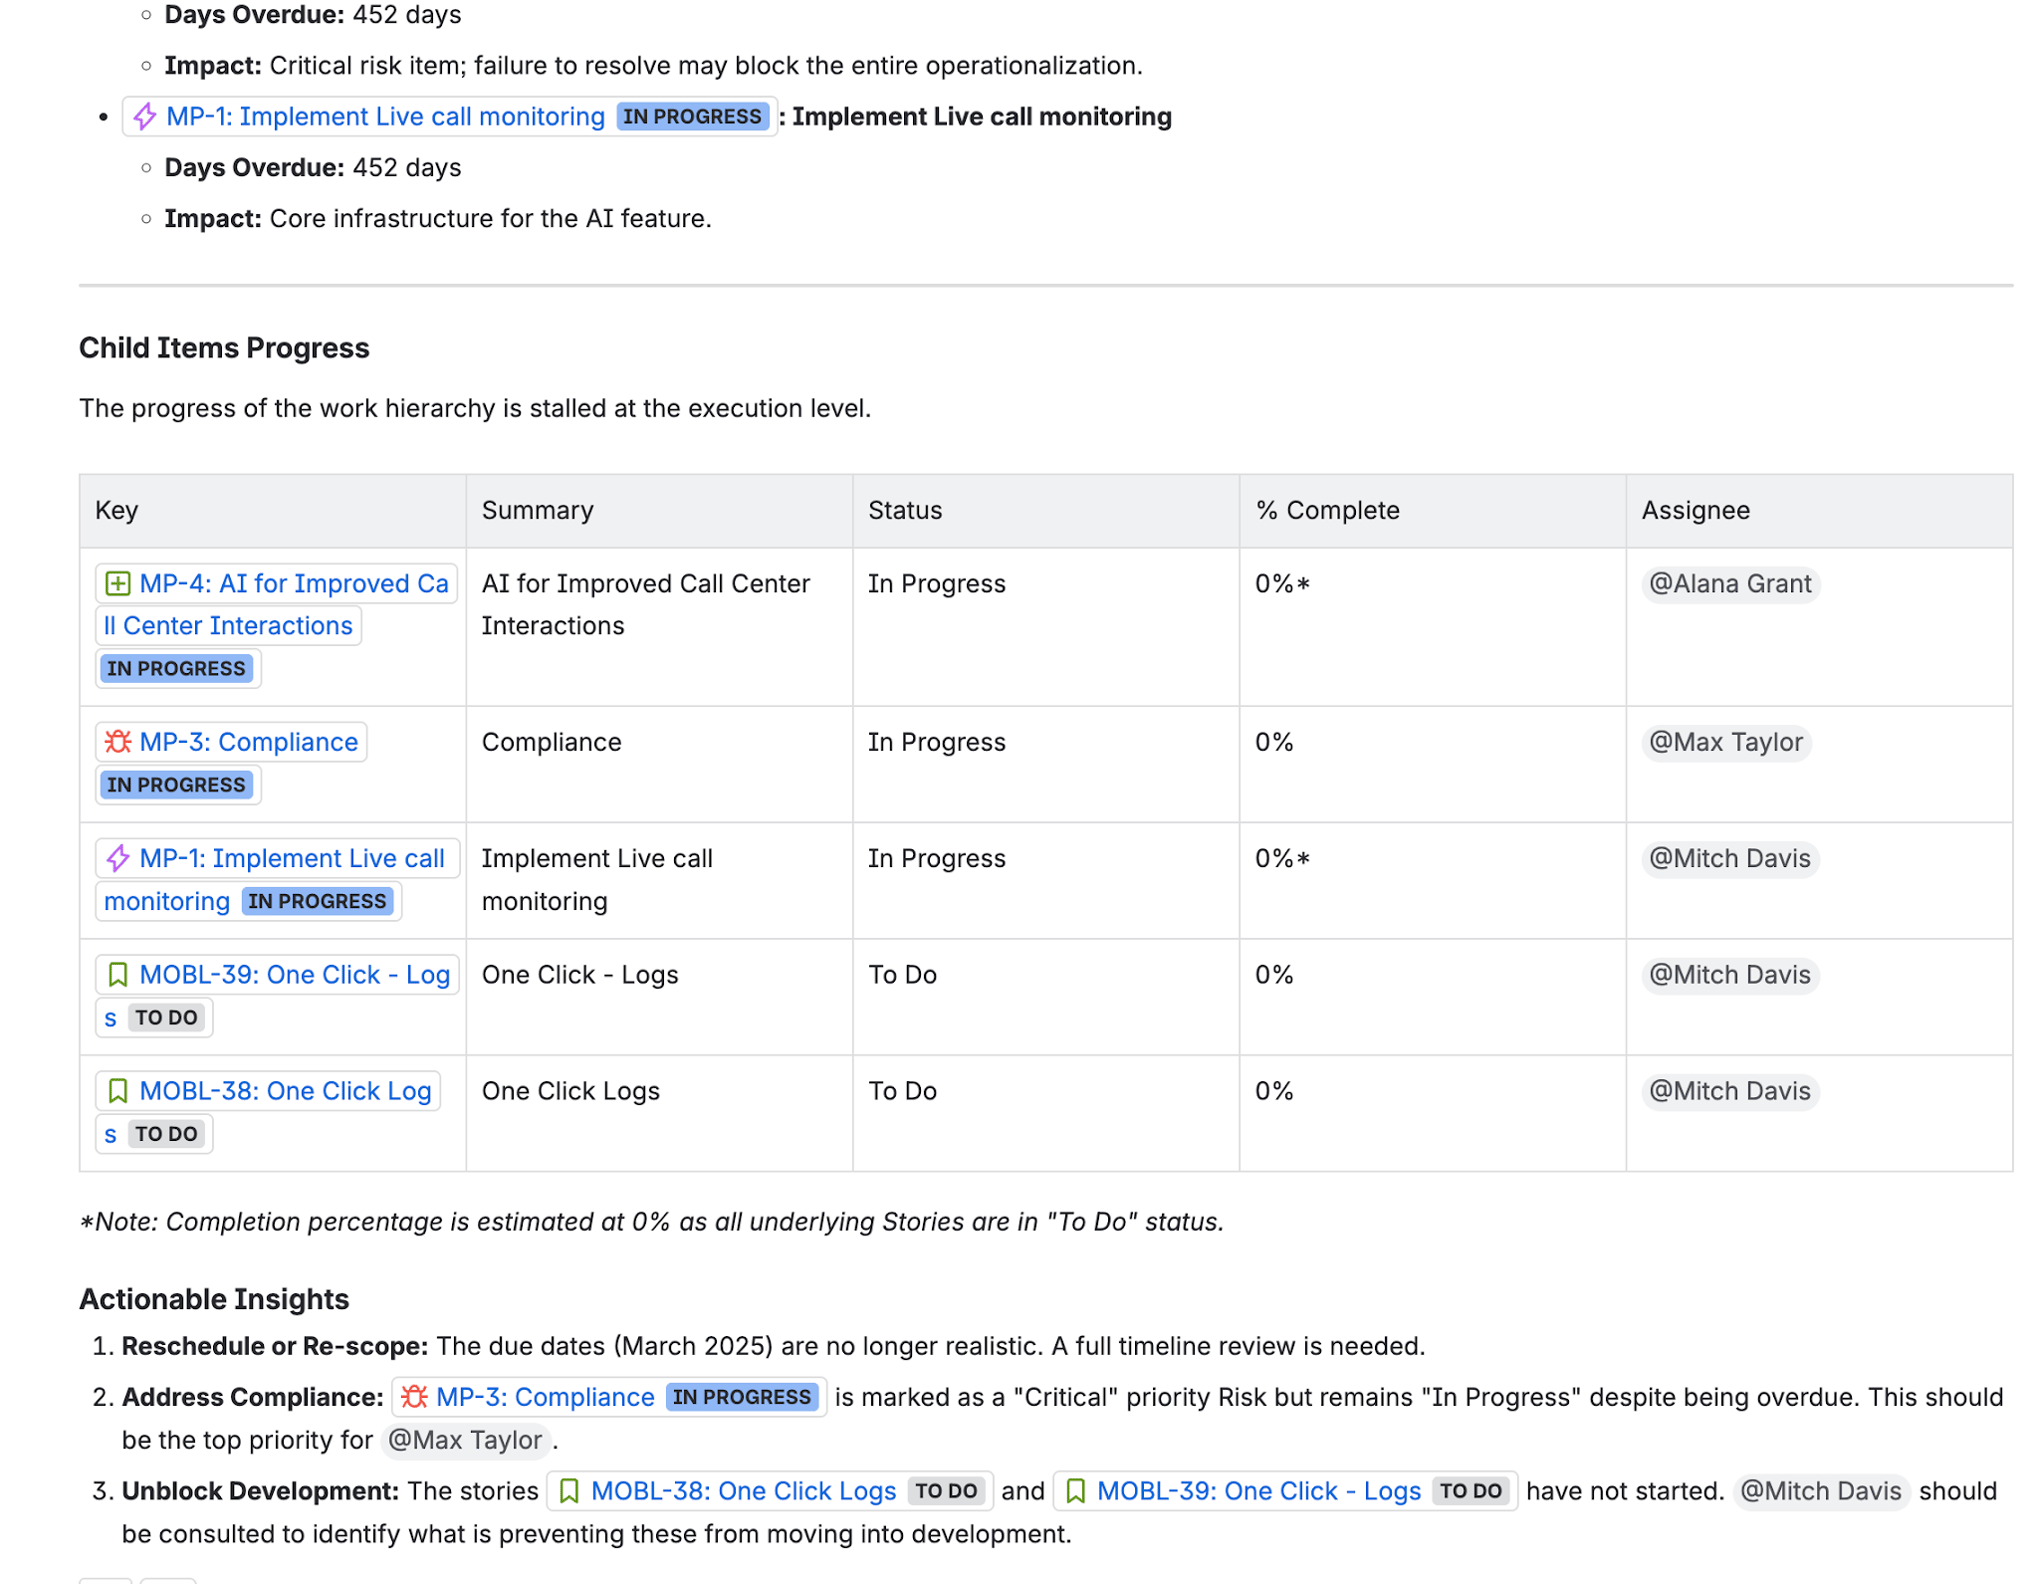
The next step is to have the AI write the narrative draft. Once an AI agent is enabled inside the Jira platform and can write back to a field, the agent reads the initiative and its graph context — children, dependencies, risks, comments, dates — and writes a draft status comment using the same template. The delivery manager reviews it, edits what the AI got wrong, adds judgment the AI could not, and approves.
In this example, I’ve used Atlassian Studio to develop an agent called ‘Summarized Connected Work items’. I’m calling the agent from within the work item and it writes to the comments.
Bottom line
The shape of the manager's job changes. Most weeks, the draft is correct or close to it. Their role becomes catching what the AI missed: the political nuance, the context from a side conversation, the thing not yet in the data. That is the work humans are uniquely positioned to do; it is not the work of typing the same thing into five boxes.
|
✓ Pros |
✗ Cons |
|
Manager moves from writing to reviewing — most weeks, a quick check is enough |
Requires an AI agent enabled in your platform with write capability |
|
AI has access to the full graph context (children, dependencies, comments, dates) |
Trust in AI-generated output must be established gradually |
|
Same downstream path as the simpler tiers — reporting unchanged |
Manager weekly attention is still required for the review step |
|
Significant time savings on the narrative itself |
Full automation
The most ambitious version closes the loop. AI generates the weekly status. The manager approves with a single click. Automation pushes the data to the reporting layer. A document generator produces whatever artifact your executives are used to receiving — PowerPoint, PDF, email — from a template. The artifact is distributed automatically.
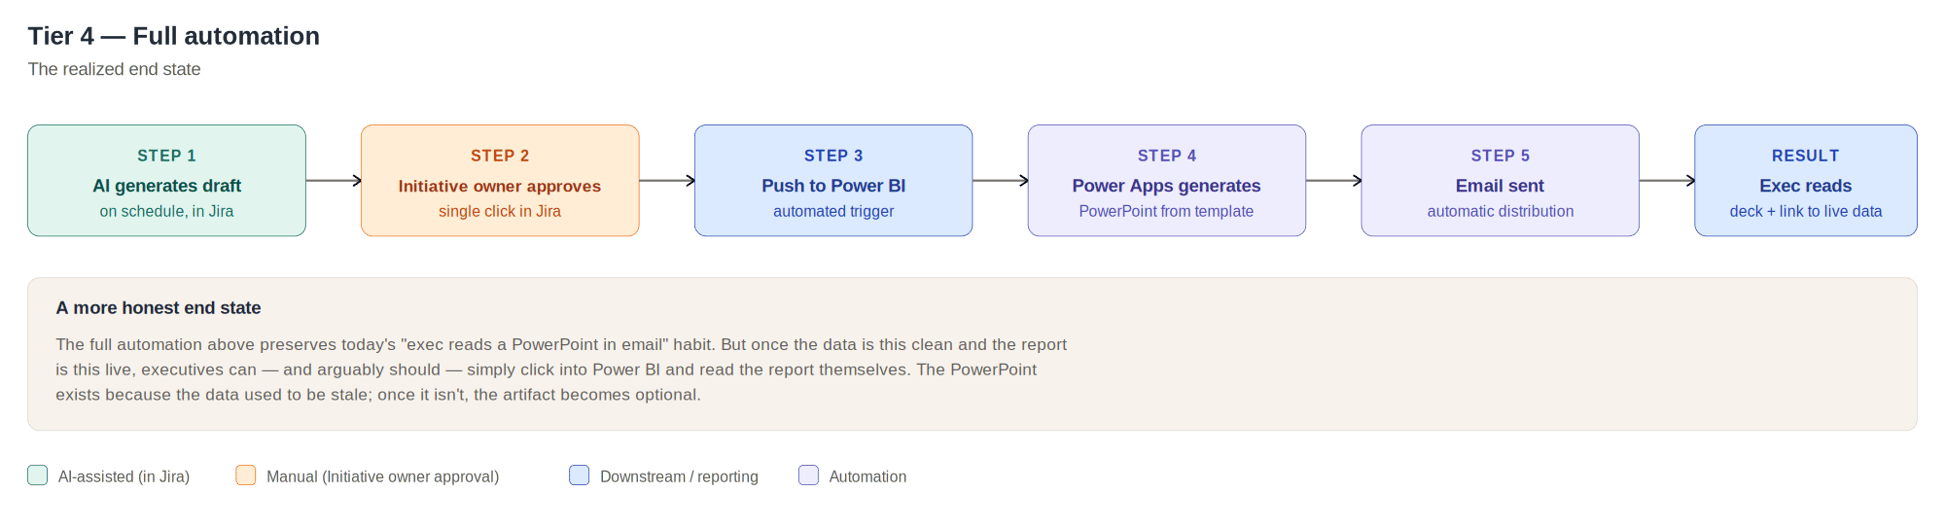
This tier is worth naming for a different reason than the others. The full automation above preserves today's habit — executives reading a deck in their inbox. Once the data is this clean and the report is this live, that habit is not what the data needs. It is what leadership is used to. The deck exists because the data used to be stale. Once it isn't, the artifact becomes optional.
|
✓ Pros |
✗ Cons |
|
Manager's only weekly step is a click of approval |
Requires every upstream tier to be in place — biggest cumulative engineering lift |
|
Artifact generation is automatic — no manual deck assembly |
AI may generate confident-sounding errors that pass through a fast approval click |
|
Distribution is automatic |
Preserves the "executive reads a deck" habit even when the live data is the better source |
|
Maximum time savings across the entire process |
Cultural change: leadership must trust an artifact they did not see assembled |
Bottom Line
The more honest end state may be that executives stop receiving the weekly deck and start opening the live view when they want to know something. That is a culture shift, not a tooling change. But it is the conversation that this whole question eventually opens.
What to actually do
Start at the floor. The template-in-a-comment pattern works today, requires no new tooling, depends on no AI capability you have not already enabled, and puts your data into the right shape for every subsequent evolution. Whatever else changes, the narrative-from-the-human / data-from-the-system pattern is the foundation. The AI tiers are upgrades to the same underlying pattern, not replacements for it.
The bigger question is harder. We are not asking your organization to commit to AI-native reporting tomorrow. We are asking you to make a choice about whether the goal is to preserve a process that emerged in a very different era, or to take this moment to ask what reporting should actually do — for the people who write it, for the people who read it, and for the work itself.
If your weekly status report is still organized around the same buckets PMBOK proposed in the era of typewriters, that is not because those buckets are right. It is because no one has questioned them. The buckets were a workaround for the absence of any other way to surface what was happening. That absence is gone.
The report can change. The question is whether you want it to.
If your organization is rethinking how it reports status across its portfolio, we'd love to talk. Praecipio helps leaders move from tracking work to acting on it.