
Most companies have a multitude of systems that communicate with each other in varying capacities. Sometimes, they just send data points to each other, or they share widgets that people can see. Or maybe they send over vast amounts of data that get merged and show up elsewhere.
These interconnections between different technologies are usually built first to solve a workflow problem. For example, someone needs an account number or other financial data point in System A to show up in System B. While these integrations are powerful for data collection, they are rarely built with real-time reporting visibility in mind.
Why Stale Data Is Costing Organizations Big Time
A recent Fivetran study found that 86% of respondents need access to real time reporting of ERP data to make smart business decisions, yet "only 23% of responding companies have systems in place to make that possible." The study emphasizes that when organizations don’t have access to accurate, real time data they make poor business decisions, which ultimately leads to lost revenue.
This is especially true in the software development space. Despite tool advancement, the gap between what we said we wanted to do and how/if it's getting done is still as huge as it was 20 years ago. If this sounds like your organization, you’re not alone. You need access to up to date information to identify areas of improvement and make better decisions.
Lots of big consulting firms have been telling companies that to have visibility of high-value data, they must undergo a complete people, process, and tool transformation. However, such a massive cultural shift means changing how teams work, which can be painful and expensive. So, we’d like to propose a new, simpler way to approach how your organization improves its reporting visibility.
How to Improve Reporting Visibility and Enhance Decision-Making Without Disrupting Teams
Instead of disrupting teams and organizing them for reporting purposes, layer a reporting structure on top of what teams are already doing to gain valuable insights and make informed decisions. There are hundreds of tools you can use for this, but there is one common denominator that meets all the typical business requirements.
You will need a person exclusively dedicated to reporting. This may seem like an unnecessary expense, but when you think about the overrun costs on projects (often in the millions!) that could have been avoided with visibility into the right real-time data, that number pales in comparison.
Let’s dive into three simple ways to improve reporting visibility and reduce costs without completely transforming teams. We use the example of a company that manages software development work with Jira Software and explore solutions in order of implementation effort required, starting with the lowest and going to the highest.
1. Build A User-Friendly Dashboard
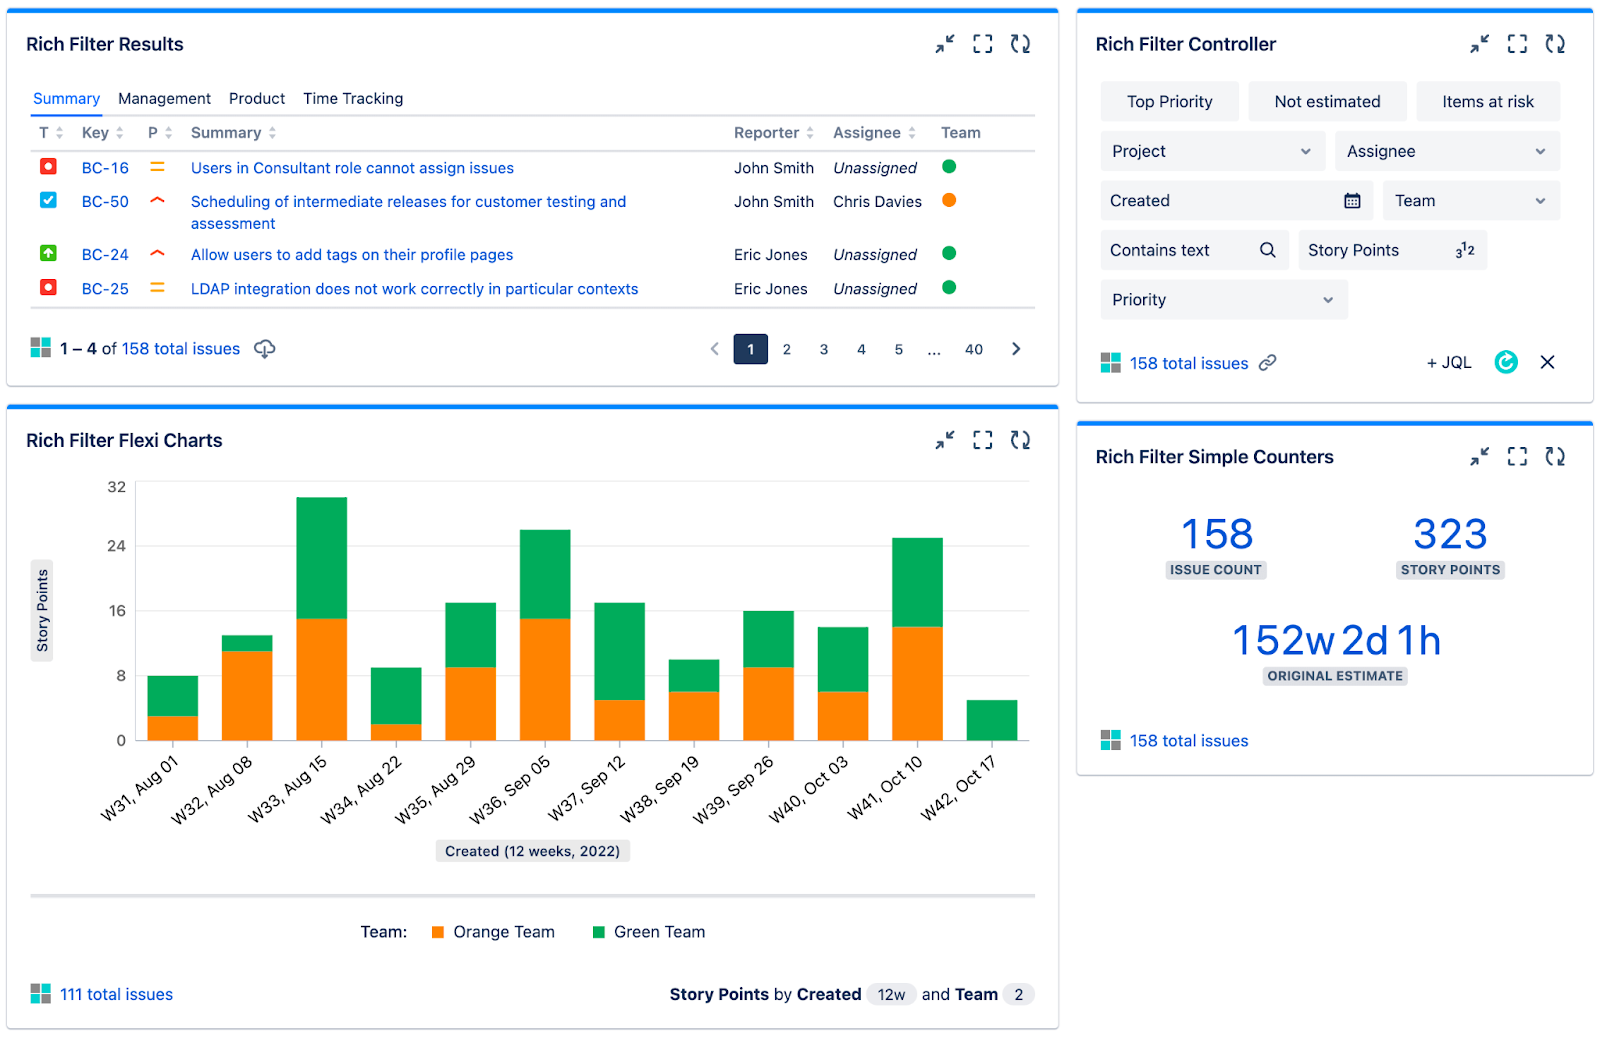
Build a dashboard using Jira Software or one of the third-party tools in the Atlassian Marketplace, like Rich Filters. These simple reporting apps enable you to create groupings of data (filters) based on fields in Jira Software.
Those groupings are then used to provide visualizations of the real time data. Creating these interactive dashboards gives you basic information across the data aggregations you care about, without having to alter the ways your teams work.
2. Use An Overlap App to Analyze Data
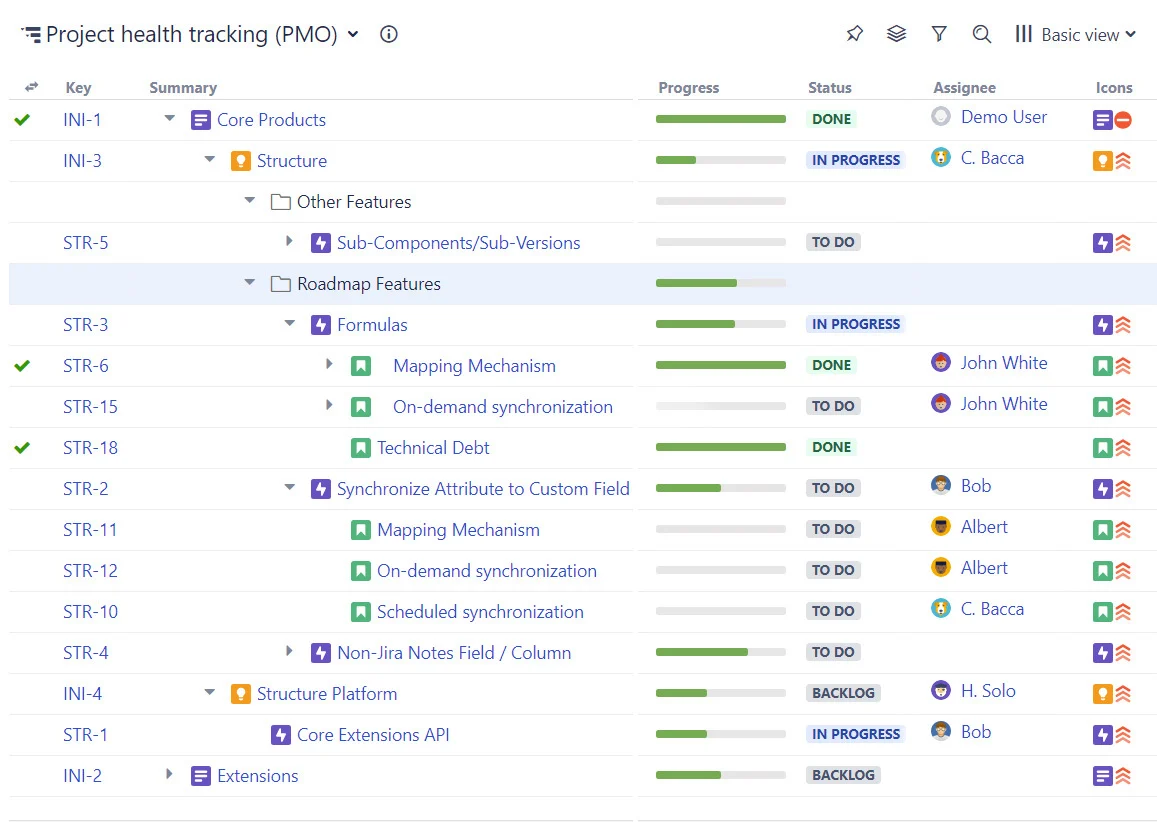
Overlap apps like Tempo Structure allow you to stack a structure on top of the team-defined structure, enabling you to analyze data, view, organize, and manage work in one place using flexible hierarchies. This means that you could, for example, have a portfolio structure that aggregates teams into programs without having to move the teams in Jira Software.
3. Use A Business Intelligence Tool for Real-Time Reporting Capabilities
Using a powerful tool for Business Intelligence (BI) like PowerBI or Tableau enables you to pull real time data from various systems and aggregate that data exactly how you want. The benefit of BI tools is that you can publish insights to an internal intranet, which means leadership can gain deeper insights without going into the tools that teams are working with.
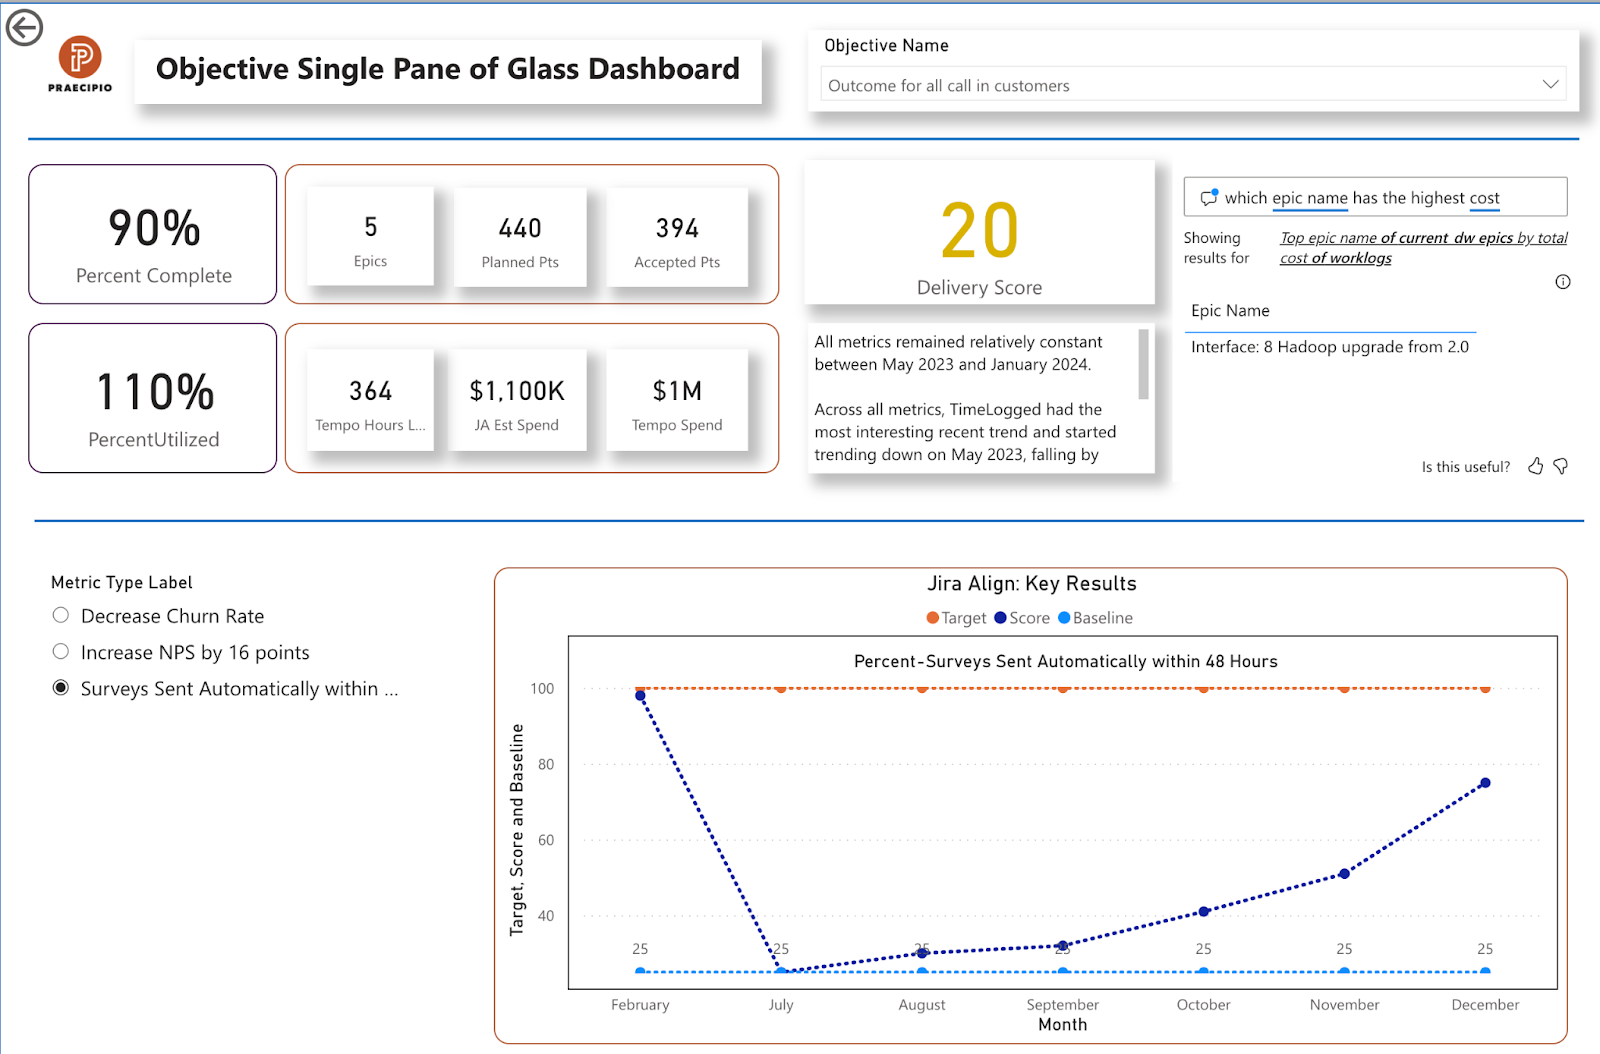
BI tools are becoming increasingly sophisticated with new Artificial Intelligence (AI) and Machine Learning (ML) technologies that can review your data over time, spot trends, and provide valuable insight. They can also allow you to ask questions about the data in simple language without having to write a complicated query or even use a lot of filters.
For example, you can simply ask, “What’s my highest cost initiative this quarter?” and you will get the accurate data you need. BI tools make all of this possible without having to disrupt how your teams work.
In the example below, we use a BI tool to combine strategic, real time data from our portfolio management tool with work data from our work management tool and timesheet data from our time tracking tool. The result is a comprehensive view of how strategy, work execution, and cost are tracked against each other.
Get Your Data Organized for Improved Decision-Making
Your data is the lifeblood of your organization. It’s what connects you to your customer, but it has little to no value when locked away in data silos. The reality of today’s organizations is they rely on different platforms to move work forward. This means their data comes from multiple sources.
Before you analyze anything or make any big business decisions, you need reliable data that is organized and centralized. This is key to improving reporting capabilities so you can quickly respond to the market with timely, informed decisions that impact your company's bottom line and give you a competitive edge.
At Praecipio, we are passionate about helping organizations tap into the power of enterprise intelligence to make better decisions. We have helped organizations across various industries create an integrated data ecosystem that enables them to connect work execution to business strategy.
Reach out to our team to learn more about becoming a data-driven enterprise.