

About Dashboards and Gadgets
A Jira Dashboard is a collection of gadgets that are designed to help you get an organized view of the work you're doing across your projects. A Dashboard can be configured to display many different types of information, and can be as narrow as a single project or span your entire instance.

|
For the purposes of this article we'll be looking at Dashboards in the context of cloud, but dashboards in an on-prem context will function very similarly. |
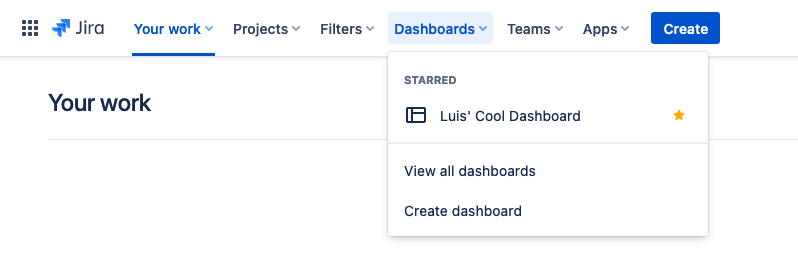
By default you won't see your Dashboards unless you navigate to the 'Dashboards' drop down list in your top navigation pane.
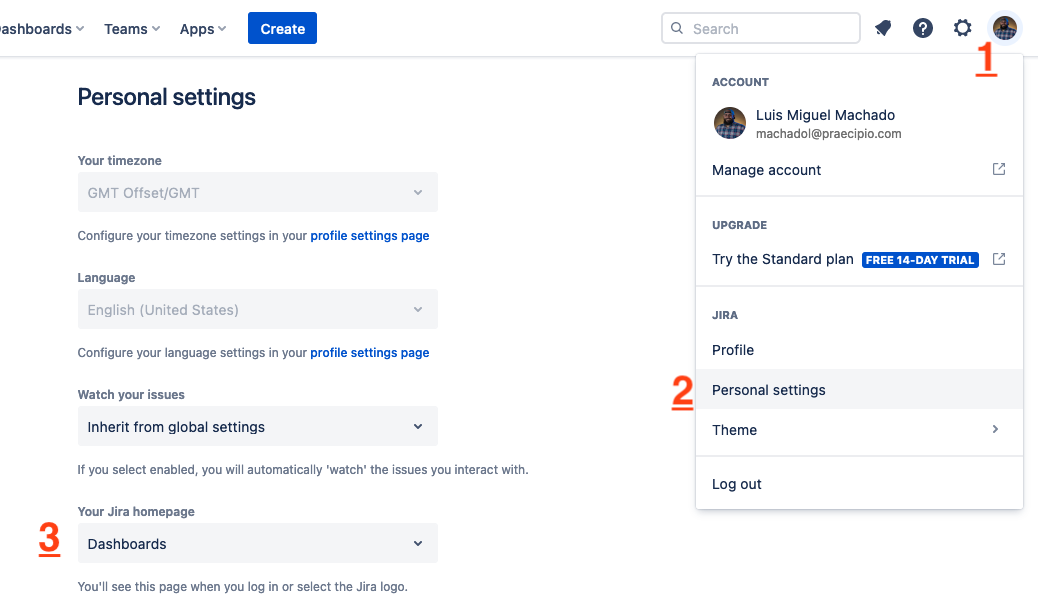
If you'd like to set your Dashboard as your home screen, you can do so by following the steps below:
- Click on your portrait in the top right hand corner of the page
- Click on Personal settings
- Click on the drop-down option under Your Jira homepage and select Dashboards (your changes are automatically saved)
Creating a Dashboard
The dashboard that you see when you first start using Jira is a default dashboard that is configured and maintained by your Jira administrator. You cannot edit the default dashboard; but you can easily create your own which you can then customize as you wish.
- Click on the Dashboards drop-down in the top navigation pane.
- Select Create Dashboard from the list of options

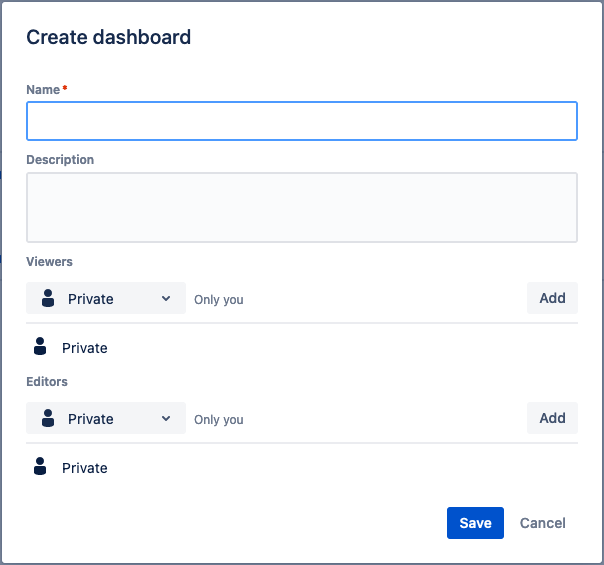
In the pop up window, you can name your dashboard, set a description for it, and set the share permissions for who can view or edit it.
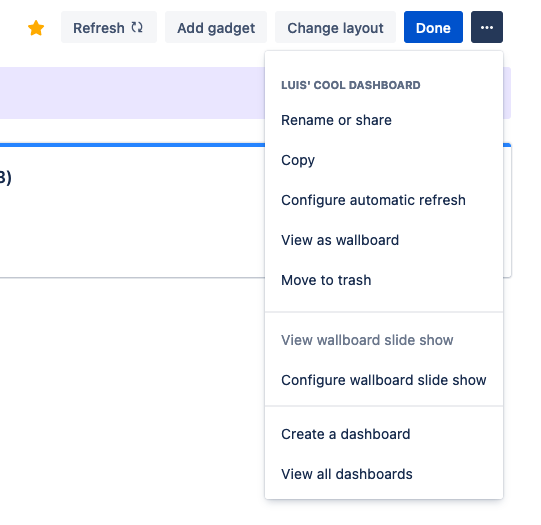
Once created, you can easily customize your dashboard by choosing from the buttons and options in the top left of the page and you can drag the gadgets into different positions after they've been added.
You can create as many dashboards as you need and each dashboard can be configured independently, for more information related to customizing your dashboards, check out Atlassian's documentation.
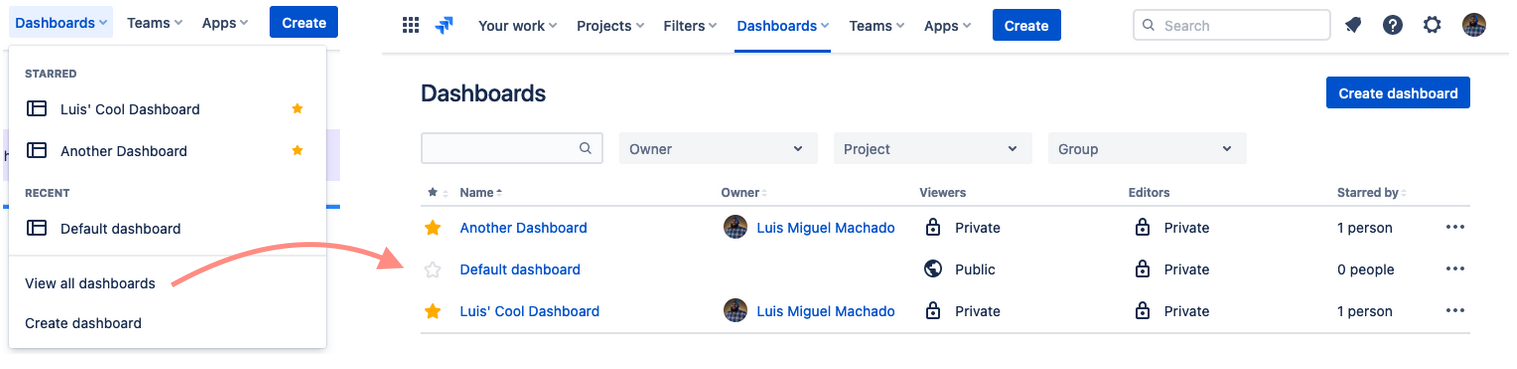
If you've created more than one dashboard:
- You can reference them all by navigating to the View all dashboards option from the Dashboards drop-down in the top navigation pane.
- You can also add dashboards to a Starred list list but clicking on the Star icon next to them.
- The Starred list will show under the Dashboards drop-down in top navigation bar above the list of dashboards you've recently visited.
Choosing a Dashboard Layout
Once your Dashboard is created there are several ways you can customize it through the edit view.
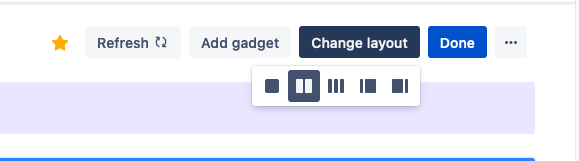
To choose a different layout for your dashboard page (e.g. three columns instead of two):
- At the top right of the Dashboard, click the Edit Layout link.
- While in the edit mode, click on the Change Layout Button. A selection of layouts will be displayed
- Click your preferred layout.
Adding a Gadget
To add a gadget to your dashboard
- Click on the Add gadget button in the top right corner of the page. A list of available gadgets will appear on the right-hand side of the page. You can also read about the entire list of gadgets for more ideas.
- You can search for a particular gadget by using the search bar at the top of the list
- You also have the option to filter the view of available gadgets based on categories listed below the search bar
When you're ready to chose a gadget, click on the Add button for that particular gadget to add it to your dashboard.

Moving a Gadget
Once you've added a gadget, you can move a it to a different position anytime you're in the edit view by simply clicking and dragging it.
Removing a Gadget
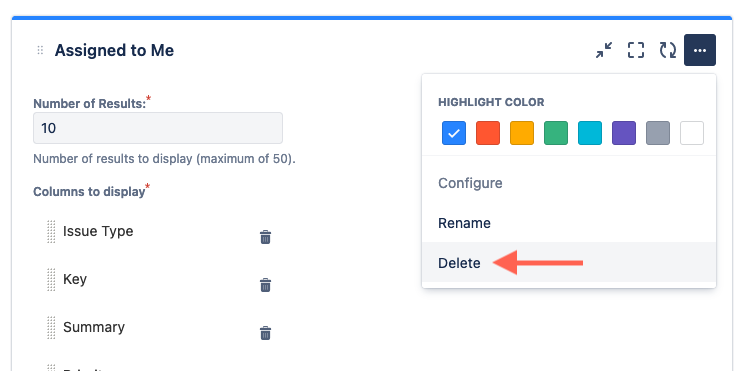
To remove a gadget from your dashboard while in the Edit view:
- Click on the 3 ellipses icon in the top right-hand corner of the gadget
- Select the Delete option
Need some more help navigating Jira Dashboards? Read our article about dashboards in Jira Service Management, or contact our team of experts and we’ll answer any questions you may have.
